

A potential customer clicks your ad, ready to explore, then waits for the page to load. Research cited in this guide puts the attention window at roughly 0.3 to three seconds. That is not a countdown for every visitor to leave. Still, a delay can waste attention and weaken trust before your content appears.
A slow experience can interrupt product discovery before someone reaches an inquiry form or checkout. Website speed optimization is a business priority because a smoother visit helps people engage with your brand. It can also support SEO, though no change guarantees higher rankings or more sales.
This guide takes a practical, evidence-led approach. Use data, tools, and clear metrics to find the changes that matter most—not to treat every technical fix as equal. IBP helps businesses set useful priorities, measure results, and improve website performance with visitors in mind.
Key Takeaways
- Early content visibility can help hold a visitor’s attention.
- Delays may disrupt discovery and reduce confidence.
- Page speed supports a smoother user experience.
- Performance changes should follow evidence and clear priorities.
- IBP helps teams track practical improvements that serve people.
Why Website Speed Optimization Is a Business Priority
A delay can turn a simple browse into a moment of doubt. Strong website performance helps people reach useful details while they still feel ready to explore.
How Slow Pages Disrupt Product Discovery and Customer Confidence
When a product page takes too long to appear, shoppers may lose their place in the journey. They might miss key details, question whether the store is reliable, or close the browser before reaching an inquiry form or checkout. A slow server can add friction at the point when confidence matters most.
Review where delays affect product discovery, forms, and purchases. Faster websites are linked with lower bounce rates and higher conversion rates, but many factors shape those outcomes. A smoother user experience can help; it cannot guarantee a sale.
Use the Three-Second Rule as a Hook, Not a Sales Cutoff
The cited attention window ranges from about 0.3 to three seconds. Treat the familiar three-second rule as a prompt to investigate, not a hard deadline for every audience. Different users, devices, and tasks call for context.
Three seconds is a useful warning, not a universal sales cutoff.
- Check which steps take the most time.
- Watch for friction before a decision.
- Use evidence to improve website speed where it matters.
Common Causes of Slow Website Performance
Behind a polished storefront, small technical choices can quietly hold back a page. Common causes include large images, heavy code, weak caching, and slow replies from the server.
Oversized Images, Excessive Scripts, and Unnecessary Plugins
Oversized images take longer to download, especially across a busy network. Too much CSS and JavaScript adds files and requests for the browser to retrieve and process. Extra plugins or widgets can add more resources and server work, delaying the first response.

- Large image files can delay page load and visible content.
- Unused plugins may add code, requests, and processing time.
- HTTP/2 can send multiple files over one connection, but removing needless items is still a useful first step.
Weak Caching and Slow Server Responses
With weak browser caching, repeat visits may download the same files again. Good caching can cut bandwidth use, latency, and server workload. A slow hosting provider can also delay a request before the browser receives content. Plugin-related processing may raise time to first byte. Check these causes on your site before choosing a fix; each can affect website performance in a different way.
Audit Page Speed with PageSpeed Insights and Real-User Data
A lab score can point to trouble, but it cannot show every visit. Run a PageSpeed Insights audit, then compare its findings with real-user Core Web Vitals data. This pairing helps explain how your website performs across real devices and networks.
Review Core Web Vitals, Including Largest Contentful Paint
Review Largest Contentful Paint, or LCP, alongside layout and interaction metrics. Google’s earlier set included First Input Delay; Interaction to Next Paint has since replaced it. At the 75th percentile, an LCP of 2,500 milliseconds or less is good. Above 4,000 milliseconds is poor.
Check the request waterfall, too. It shows when the browser asks the server for resources and whether the main image loads late. This detail can reveal causes that a summary score may hide.
Focus on Mobile Visitors and Key Sales Pages
Test key product, lead, and checkout pages on both mobile and desktop. Mobile users may face different network limits, so desktop results alone miss part of the experience. Tools such as Sematext Synthetics and Sematext Experience can add lab tests and real-user data. Use those metrics to choose fixes based on visitor impact.
Apply Practical Fixes to Help Your Website Load Faster
Small changes can make key content appear sooner without a full rebuild. Start with the files that shape the first view, then test each change to see how it affects real visits.
Compress Images and Streamline CSS and JavaScript
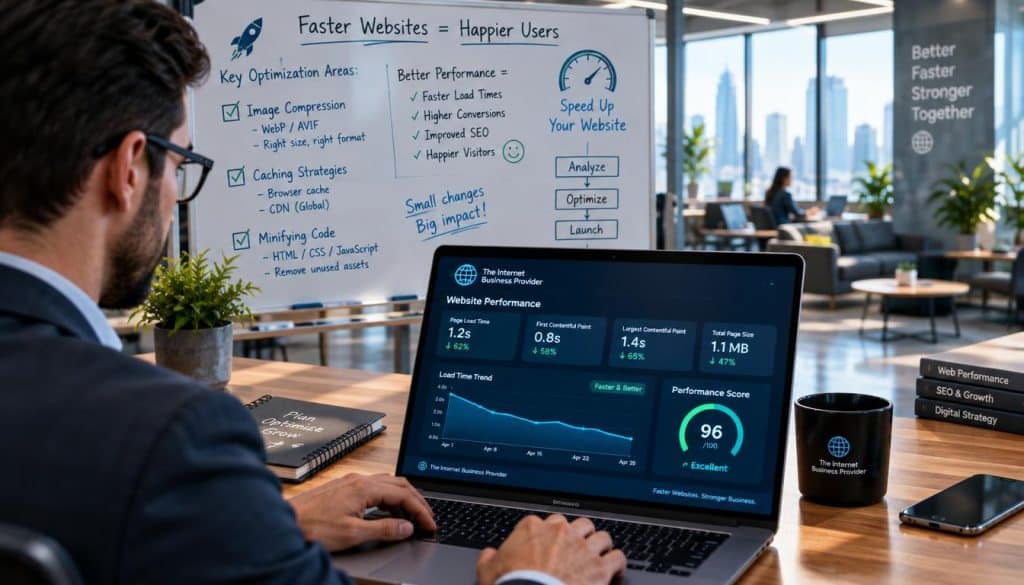
Resize images to fit their display area and choose efficient formats. A request waterfall showed a 12-kilobyte main image taking nearly a second to download while other requests competed for bandwidth. Remove unused CSS and JavaScript, and defer scripts that do not support the first view. The Web Almanac found that about 70% of websites use text compression correctly, so this remains a useful check.
Enable Effective Browser and Server Caching
Set browser and server caching to reuse files on repeat visits and reduce server work. Check cache rules after updates so visitors still receive fresh content. A content delivery network can also serve resources closer to users.
Reduce Unnecessary Files, Scripts, and Requests
Prioritize resources that reveal useful page content. Lighthouse flagged a Pinterest JavaScript file with 1.9 kilobytes of possible savings. Treat audit results as clues, not commands: one test improved Largest Contentful Paint by 45%, while First Contentful Paint rose by 13%. Measure the full experience before keeping a change.
Improve Server Response with Suitable Hosting and Content Delivery
Your hosting plan affects how quickly a server begins to answer requests. Track time to first byte (TTFB): below 200 milliseconds is great, 200–500 milliseconds is normal, and a steady result above 600 milliseconds calls for a closer look.
Shared, VPS, dedicated, and serverless hosting suit different needs. Measure your current results before you switch plans or provider. A new host may not improve every page, so compare real data first.
“The right infrastructure earns its value when the evidence shows it removes a real delay.”
A content delivery network (CDN) uses servers in many locations to serve static files closer to each user. This can cut delivery time for images, code, and other resources, helping a page load faster across a broad network. HTTP/2 may also help browsers request web files more efficiently.
If TTFB points to a server bottleneck, review application logic, database queries, and available memory or CPU. Then assess website performance and the full user experience after each change. Let measured results—not assumptions—guide hosting and content delivery choices.
Measure Performance Improvements and Business Outcomes
Good measurement links technical changes to real customer actions. Set a baseline before you adjust code, files, or server resources. Then compare the same metrics over a similar period to see whether you improve website performance.
Track Loading Performance Alongside Customer Actions
Pair largest contentful paint with completed enquiries and checkout completion. Real-user tools such as Sematext Experience show how page speed varies across visitors and pages. Review the data by device and request type to find patterns. Better website speed can support user experience and SEO, but it does not guarantee rankings or revenue.
Compare Results Before and After Changes
Compare conversion rates before and after each change, while accounting for other factors that may affect results. One test improved Largest Contentful Paint by 45% but raised First Contentful Paint by 13%. That tradeoff shows why teams should measure, not assume. Use the findings to guide further optimization.
| Metric | What to compare | What it shows |
|---|---|---|
| Loading | Baseline and follow-up paint metrics | How soon key content appears |
| Customer actions | Enquiries and completed checkouts | Whether journeys become smoother |
| Conversions | Rates before and after a change | Business trends, not proof of cause |
Conclusion
The 0.3-to-3-second attention window is a prompt to investigate, not a cutoff that predicts every user’s choices. Start with an audit of key pages, then address the technical issues that affect visitors most.
Compare loading data with real-user feedback after each change. Test how a page appears in a browser and across the web, including on mobile. Faster load times may support the user experience and SEO, but they cannot guarantee rankings, inquiries, completed checkouts, or revenue.
IBP helps teams improve website performance through clear priorities and measured action, not a chase for perfect scores. Discuss your goals with IBP to find practical next steps for visitors and your business.
